Published Data on the Status of Promoting the Advancement of Women and Surveys on the Degree to which Women Have Advanced
Shimizu publishes data on initiatives aimed at promoting the advancement of women. We will continue to work on establishing an environment that enables a diverse range of human resources to participate more actively, in the future as well
Shimizu discloses its numerical goals and other information on the promotion of women in accordance with the Act on Promotion of Women's Participation and Advancement in the Workplace (a law for establishing an environment that will enable women to fully manifest their capabilities and advance in their work careers, according to their wishes), which was enacted on August 28, 2015.
As of April 1 each fiscal year
| 1.Status of Women in Management Positions | |||||
|---|---|---|---|---|---|
| FY 2020 | FY 2021 | FY 2022 | FY 2023 | FY 2024 | |
| Number of women in management positions*/Total number of management positions | 118/ 4,107 |
126/ 4,084 |
140/ 4,234 |
170/ 4,407 |
224/ 4,609 |
| Number of women newly promoted to management positions/Total number newly promoted to management positions | 18/ 164 |
14/ 181 |
15/ 188 |
30/ 228 |
57/ 292 |
Women in management positions indicates people in a management position of section manager or higher.
As of June 27, 2024
| 2.Status of Women in Officers Positions | |
|---|---|
| Number of women directors/Total number of directors | 2/11 |
| Number of women directors (internal)/Total number of directors (internal) | 0/7 |
| Number of women audit & supervisory board members/Total number of audit & supervisory board members | 1/5 |
| Number of women executive officers/Total number of executive officers | 1/52 |
As of April 1, each fiscal year
Number of new graduate hires is as of May 1, 2024
| 3.Employment Status | |||||
|---|---|---|---|---|---|
| FY 2020 | FY 2021 | FY 2022 | FY 2023 | FY 2024 | |
| Number of women employees/ Total number of employees |
1,710/ 10,765 |
1,780/ 10,892 |
1,878/ 11,083 |
1,981/ 11,212 |
2,107/ 11,364 |
| Number of full-time women employees/ Total number of full-time employees |
1,653/ 9,954 |
1,701/ 10,708 |
1,817/ 10,317 |
1,920/ 10,559 |
2,062/ 10,892 |
| Number of women new graduate hires/ Total number of new graduate hires |
96/ 345 |
104/ 354 |
104/ 365 |
108/ 335 |
104/ 380 |
Results for FY 2023
| 4.Status of Work-Life Balance | |
|---|---|
| Percentage of men who took childcare leave | 81.0% (including Paternity Leave) |
| Percentage of women who took childcare leave | 100.0% |
| Percentage who took paid leave | 62.6% |
| Average number of days of paid leave | 12.4 days |

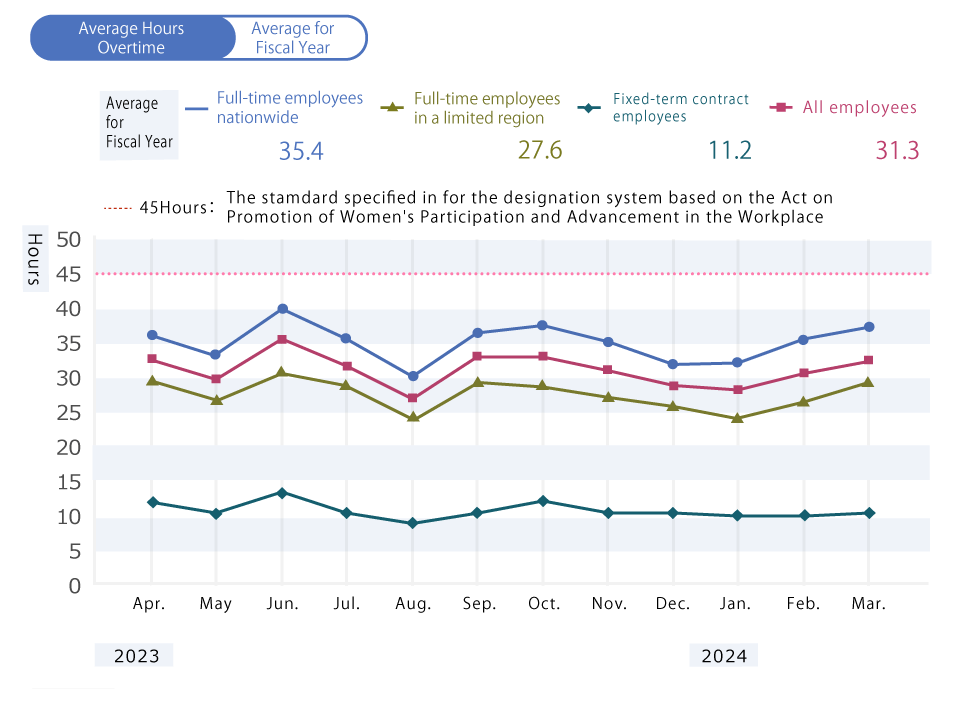
Details of Initiatives Aimed at Correcting Long Work Hours
- Changing mindsets through internal awards for good examples of workstyle reform, communication of the messages from the President, etc.
- Reviewing the production system and promoting work sharing to improve operational efficiency
- Flexible workstyles such as introduction of a telecommuting system and staggered working hours
- Thorough follow-up to make sure that 100% of compensatory days off have been taken
- Annual paid leaves grant an hourly or a half-day basis, and compensatory days grant a half-day basis
- System that provides time off for various occasions, such as annual sabbaticals for refreshment, time off for relocation to new assignments, etc.
- Planned annual vacation time system
As of March 31, 2024
| 5.Average Years of Continuous Employment by Gender and Area of Management | |||
|---|---|---|---|
| Men | Women | Continuous years of employment%(Women/Men) | |
| All employees | 19.0 years | 14.0 years | 74% |
| (of which, full-time employees nationwide) | 19.0 years | 6.8 years | 36% |
| (of which, full-time employees limited to a specific region) | 19.1 years | 18.8 years | 98% |
Average for FY 2022 to FY 2024
| 6.Ratio of Job Openings to Job Seekers, by Gender | ||
|---|---|---|
| Women | Men | |
| Full-time employees nationwide(technical ) | 3.7 x | 3.6 x |
| Full-time employees nationwide(clerical) | 17.3 x | 23.2 x |
| Full-time employees limited to a specific region(technical ) | 2.5 x | 3.1 x |
| Full-time employees limited to a specific region(clerical) | 11.1 x | 10.8 x |
Entered company from FY 2013 to FY 2015
| 7.Percentage Continuously Employed Near the 10th Anniversary of Hiring, by Gender | ||
|---|---|---|
| Men | Women | |
| All employees | 79.8% | 84.8% |
| (Of which, full-time employees nationwide) | 81.4% | 86.9% |
| (Of which, full-time employees limited to a specific region) | 72.0% | 78.6% |
Total for FY 2020 to FY 2023
| 8.Statistics on Change in Occupation and Employment Status, by Gender | ||
|---|---|---|
| Men | Women | |
| Fixed-term contract employees promote to unlimited term employment | 92 | 87 |
| Full-time employees promoting from limited region status to nationwide status | 16 | 5 |
1~8, Shimizu Corporation Construction data


