Third-party Guarantee
The actual values marked with a ☑ among the following environmental performance data have received a third-party guarantee from Ernst & Young ShinNihon LLC.
Boundaries
Starting from the FY2023 results, environmental performance data is disclosed by combining the data from The Nippon Road Co., Ltd. and Maruhiko Watanabe Construction Inc.
Decarbonization
Emissions from overseas subsidiaries and certain affiliates are estimated using domestic emissions data and overseas net sales figures.
CO2Emissions: Results and Goals(Scope1&Scope2)
| Category | Unit | FY2022 | FY2023 | FY2024 | |
|---|---|---|---|---|---|
| Actual | Actual | Actual | |||
| During Construction | Scope1 | t-CO2 | 150,718 | 159,723 | ☑153,140 |
| Scope2 | 45,400 | 62,764 | ☑50,793 | ||
| Total | 196,118 | 222,487 | ☑203,933 | ||
| Intensity | t-CO2/ amount of sales (¥100 millions) |
11.29 | 13.35 | 12.34 | |
| Own Offices + Storehouses and factories |
Scope1 | t-CO2 | 2,878 | 62,764 | ☑86,495 |
| Scope2 | 15,713 | 35,038 | ☑24,303 | ||
| Total | 18,591 | 97,802 | ☑110,798 | ||
| Total | Scope1 | t-CO2 | 153,596 | 222,487 | ☑239,635 |
| Scope2 | 61,113 | 103,040 | ☑75,096 | ||
| Total | 214,709 | 325,527 | ☑314,731 | ||
Note: These emission boundaries cover both domestic and overseas consolidated entities, where “domestic and overseas consolidated” refers to individual and consolidated subsidiaries.
The significant year-on-year increase in CO2 emissions from our own offices, storehouses, and factories in FY2023 is primarily due to the inclusion of CO2 emissions from The Nippon Road Co., Ltd. in the calculation.
Until FY2022, diesel fuel used for transporting construction-generated soil had been classified as Scope 1 during the construction phase. However, following the partial systematization of calculations and a comprehensive review of the overall methodology, this fuel use was reclassified as Scope 3 Category 5 (waste generated by the business). As a result, the Scope 1 emissions during construction listed above exclude 19,724 t-CO2 for FY2023 and 8,482 t-CO2 for FY2024 related to the fuel used for transporting construction-generated soil. These emissions are now included under Scope 3 Category 5. The FY2022 figures in the table above do not reflect the impact of this change.
Supply Chain CO2 Emissions(Scope3)
| Category | Unit | FY2022 | FY2023 | FY2024 | note |
|---|---|---|---|---|---|
| 1.Purchased goods / services | t-CO2 | 1,783,512 | 3,153,525 | ☑2,448,112 | Actual values are used for steel materials, rebar, ready-mixed concrete, cement, aluminum products, glass, asphalt mixture, and crushed stone. All other materials are calculated using the company’s internal system. |
| 2.Capital goods | 211,335 | 161,232 | ☑87,531 | ||
| 3.Fuel and energy related activities | 18,285 | 40,161 | ☑22,969 | ||
| 4.Upstream transportation and distribution | 21,917 | 46,463 | ☑29,166 | ||
| 5.Waste generated from business | 144,583 | 161,320 | ☑116,369 | ||
| 6.Business trip | 2,583 | 2,667 | ☑2,767 | ||
| 7.Employee commuting | 5,784 | 5,919 | ☑6,109 | ||
| 8.Upstream leased assets | ‐ | ‐ | ‐ | Not included in the calculation | |
| 9.Downstream transportation and distribution | ‐ | ‐ | ‐ | Not included in the calculation | |
| 10.Processing of products sold | ‐ | ‐ | ‐ | Not included in the calculation | |
| 11.Use of sold products*1 | 3,753,163 | 3,516,269 | ☑1,032,399 | Design and construction projects (domestic and overseas, 50-year operation period) | |
| 12.Disposal of sold products | 83,302 | 110,949 | ☑59,700 | ||
| 13.Downstream lease assets*2 | 24,390 | 37,465 | ☑44,136 | ||
| 14.Franchise | ‐ | ‐ | ‐ | Not included in the calculation | |
| 15.Investment | ‐ | ‐ | ‐ | Not included in the calculation | |
| Scope3 total | 6,048,854 | 7,235,970 | ☑3,849,259 |
Note: These emission boundaries cover both domestic and overseas consolidated entities, where “domestic and overseas consolidated” refers to the parent company and its consolidated subsidiaries.
Beginning with FY2023 results, cement, asphalt mixture, and crushed stone were added to the Category 1 calculation scope.
Starting from FY2024 results, following the partial systematization of calculations, other materials were also added to Category 1 (calculated using the SHIMIZU Carbon Assessment Tool). As a result, GHG emissions for “other materials” in Category 1 increased by 667,925 t-CO2 in FY2024. The figures for prior fiscal years in the tables above do not reflect the impact of this change.
Energy Use: Results and Goals
| Category | Target energy | Unit | FY2022 (Domestic and overseas consolidated) |
FY2023 (Domestic and overseas consolidated) |
FY2024 (Domestic and overseas consolidated) |
|---|---|---|---|---|---|
| During Construction | Kerosene | GJ | 33,819 | 13,979 | ☑13,898 |
| Diesel Oil | 2,132,022 | 2,232,509 | ☑2,179,660 | ||
| Heavy oil | 32,257 | 69,609 | ☑43,091 | ||
| Gasoline | 0 | 0 | 0 | ||
| City gas | 0 | 0 | 0 | ||
| LP gas | 0 | 0 | 0 | ||
| Electricity | 360,908 | 529,045 | ☑466,944 | ||
| Chilled water supplied by other entities | 0 | 0 | 0 | ||
| Heating water and steam supplied by other entities | 0 | 0 | 0 | ||
| Subtotal | 2,559,006 | 2,845,142 | 2,703,593 | ||
| Own Offices + Storehouses and factories | Kerosene | GJ | 3,844 | 5,329 | ☑16,901 |
| Diesel Oil | 8,711 | 69,481 | ☑65,828 | ||
| Heavy oil | 3,775 | 716,871 | ☑690,754 | ||
| Gasoline | 4,715 | 5,074 | ☑60,243 | ||
| City gas | 22,682 | 109,401 | ☑173,708 | ||
| 5 | 8 | ☑10 | |||
| Electricity | 148,652 | 316,146 | ☑335,089 | ||
| Chilled water supplied by other entities | 12 | 13 | ☑13,236 | ||
| Heating water and steam supplied by other entities | 7 | 6 | ☑6,196 | ||
| Subtotal | 192,403 | 1,222,229 | 1,361,966 | ||
| Total | 2,751,409 | 4,067,471 | ☑4,065,559 |
Note: Beginning with FY2023, the heavy oil (A) consumption for our own offices, storehouses, and factories includes fuel used by the company-owned SEP vessel Blue Wind.
The significant year-on-year increase in energy consumption at our own offices, storehouses, and factories in FY2023 is primarily due to the inclusion of CO2 emissions from The Nippon Road Co., Ltd. in the calculations.
In some consolidated subsidiaries, energy use had previously been estimated based on the year-on-year change in net sales. Following improvements in the data collection process, kerosene and gasoline consumption at our own offices, storehouses, and factories increased significantly in FY2024 compared to the previous fiscal year.
Resource Recycling
Waste
| Category | Unit | FY2022 | FY2023 | FY2024 | |
|---|---|---|---|---|---|
| (Domestic and overseas consolidated) | (Domestic and overseas consolidated) | (Domestic and overseas consolidated) | |||
| (Domestic non-consolidated) | (Domestic non-consolidated) | (Domestic non-consolidated) | |||
| Construction Waste*1 | Hazardous Waste | 1,000 tons | 10 | 2 | 3 |
| 8 | 1 | ☑2 | |||
| Total Waste | 1,000 tons | 2,124 | 2,690 | 1,477 | |
| 1,791 | 1,838 | ☑1,356 | |||
| Non-recyclable Waste | 1,000 tons | 64 | 304 | 113 | |
| 61 | 86 | ☑58 | |||
| Recycled Waste | 1,000 tons | 2,059 | 2,386 | 1,364 | |
| 1,730 | 1,752 | ☑1,298 | |||
| Office Waste*2 | Total Waste | 1,000 tons | 1.0 | 0.8 | 0.9 |
| 0.7 | 0.6 | 0.7 | |||
| Non-recyclable Waste | 1,000 tons | 0.2 | 0.1 | 0.1 | |
| 0.1 | 0.0 | 0.1 | |||
| Recycled Waste | 1,000 tons | 0.8 | 0.7 | 0.7 | |
| 0.6 | 0.6 | 0.6 | |||
- Note: Wastewater data represent discharges to public systems (up to FY2023 including releases to rivers, and from FY2024 covering only discharges to sewer systems).
- Water intake includes only tap water and excludes company-owned grounds, the technical research laboratory, Tokyo Mokkoujou, and investment development properties.
Resource Use
Water usage and wastewater records
We have no legal violations regarding wastewater.
| Category | Unit | FY2022 | FY2023 | FY2024 | |
|---|---|---|---|---|---|
| (Domestic and overseas consolidated) | (Domestic and overseas consolidated) | (Domestic and overseas consolidated) | |||
| (Domestic consolidated) | (Domestic consolidated) | (Domestic consolidated) | |||
| Water intake | Construction | 10,000 cubic metre | 128.0 | 127.5 | 66.9 |
| 116.5 | 117.1 | ☑59.6 | |||
| Office | 7.0 | 16.3 | 26.8 | ||
| 6.4 | 15.5 | ☑25.1 | |||
| Water Recycling (Head Office) |
- | - | - | ||
| 1.4 | 2.5 | 2.6 | |||
| Percentage of Recycled from Business Activities | % | 17.9 | 15.3 | 10.2 | |
| Total | 10,000 cubic metre | 135.0 | 143.8 | 93.7 | |
| 122.9 | 132.6 | ☑84.7 | |||
| Water discharge (Public Wastewater) |
Construction | 10,000 cubic metre | 2,940.2 | 3,584.7 | 70.8 |
| 2,675.2 | 3,293.5 | 63.1 | |||
| Office | 7.0 | 8.6 | 23.4 | ||
| 6.4 | 8.1 | 21.6 | |||
| Total | 2,947.2 | 3,593.3 | 94.2 | ||
| 2,681.6 | 3,301.6 | 84.7 | |||
Note: Wastewater data represent discharges to public systems (up to FY2023 including releases to rivers, and from FY2024 covering only discharges to sewer systems). Water intake includes only tap water and excludes company-owned grounds, the technical research laboratory, Mokkoujou, and investment development properties.
Resource Use
| Category | Unit | FY2022 | FY2023 | FY2024 |
|---|---|---|---|---|
| (Domestic and overseas consolidated) | (Domestic and overseas consolidated) | (Domestic and overseas consolidated) | ||
| Green Procurement | ||||
| Blast Furnace Ready-mixed Concrete | 10,000 cubic metre | 21.0 | 33.4 | 12.5 |
| Electric Furnace Steel Materials | 10,000 tons | 22.0 | 21.8 | 38.3 |
| Main Construction Materials | ||||
| Ready-mixed Concrete | 10,000 cubic metre | 236.9 | 375.9 | 141.2 |
| Steel Materials | 10,000 tons | 37.2 | 37.3 | 13.5 |
| Rebar | 21.6 | 21.8 | 25.7 | |
| Tropical Plywood Formwork | 1.1 | 0.2 | 0.3 | |
Note: Beginning with FY2023 results, the calculation method for tropical plywood formwork usage (including the number of times it is reused) was revised.
Pollution Prevention and Waste
We have no legal violations regarding air pollution prevention.
Emissions of Air Pollutants
| Category | Unit | Emissions source | FY2022 | FY2023 | FY2024 |
|---|---|---|---|---|---|
| (Domestic and overseas consolidated) | (Domestic and overseas consolidated) | (Domestic and overseas consolidated) | |||
| NOx | t | Electricity | 40.9 | 72.8 | 63.0 |
| Diesel Oil | 218.6 | 233.9 | 228.1 | ||
| Total | 259.5 | 306.6 | 291.1 | ||
| SOx | Electricity | 36.8 | 61.0 | 52.8 | |
| Diesel Oil | 342.6 | 384.1 | 374.6 | ||
| Total | 379.4 | 445.2 | 427.5 |
Emission source unit
NOx: 0.310g-NOx/kWh(Electricity) 3.860 g-NOx/l(Diesel Oil)
SOx: 0.260g-SOx/kWh(Electricity) 6.340 g-SOx/l(Diesel Oil)
(Source: Japan Federation of Construction Contractors)
CFC Gas
| Category | Unit | FY2022 | FY2023 | FY2024 |
|---|---|---|---|---|
| (Domestic consolidated) | (Domestic consolidated) | (Domestic consolidated) | ||
| CFC gas | t | 26.5 | 15.6 | 16.6 |
Environmental Accounting
Evaluating the Financial Impact of Climate Change(Environmental Accounting)
| Category | Cost (Millions of yen) |
|
|---|---|---|
| Energy-efficiency | Cost of energy-efficiency in Shimizu I-2 | 454 |
| R&D | Environmental business (energy-related) Ⅳ-1 | 781 |
| Cost of R&D on environmental conservation Ⅳ-2 | 1,207 | |
| Total | 2,442 | |
Financial Impact of Pollution, Waste, Materials Use
| Category | Cost (Millions of yen) | |
|---|---|---|
| Pollution | Cost of steps taken to prevent environmental pollution at the job site Ⅰ-1 | 10,865 |
| Resource recycling | Cost of proper processing of construction by-products Ⅰ-3 | 21,180 |
| Total | 32,045 | |
R&D Investment for Pollution Alleviation
| Category | Cost (Millions of yen) |
|---|---|
| R&D Investment for Pollution measure, Waste reduction, Recycling, Reuse Raw material reduction | 1,040 |
R&D Investment for Reduction of Water Relevant Risk
| Category | Cost (Millions of yen) |
|---|---|
| R&D for Water Pollution, Contaminating Soiland Grand Water | 82 |
Environment Management Activity Financial Valuation
| Category | Cost (Millions of yen) | |
|---|---|---|
| Management Operation | Construction waste measures Ⅲ-2 | 643 |
| Environmental Protection Measures | Operation and maintain of ISO14001 Ⅲ-1 | 457 |
| Environmental Burden Measures | Environment load watching measures Ⅲ-3 | 734 |
| Environmental Education | Environment related seminar attending fee Ⅲ-5 | 106 |
| Capital Investment | Energy saving capital investment Ⅶ-1 | 15 |
| Total | 1,954 | |
Note: The cost boundaries for these items are limited to domestic (non-consolidated) operations.
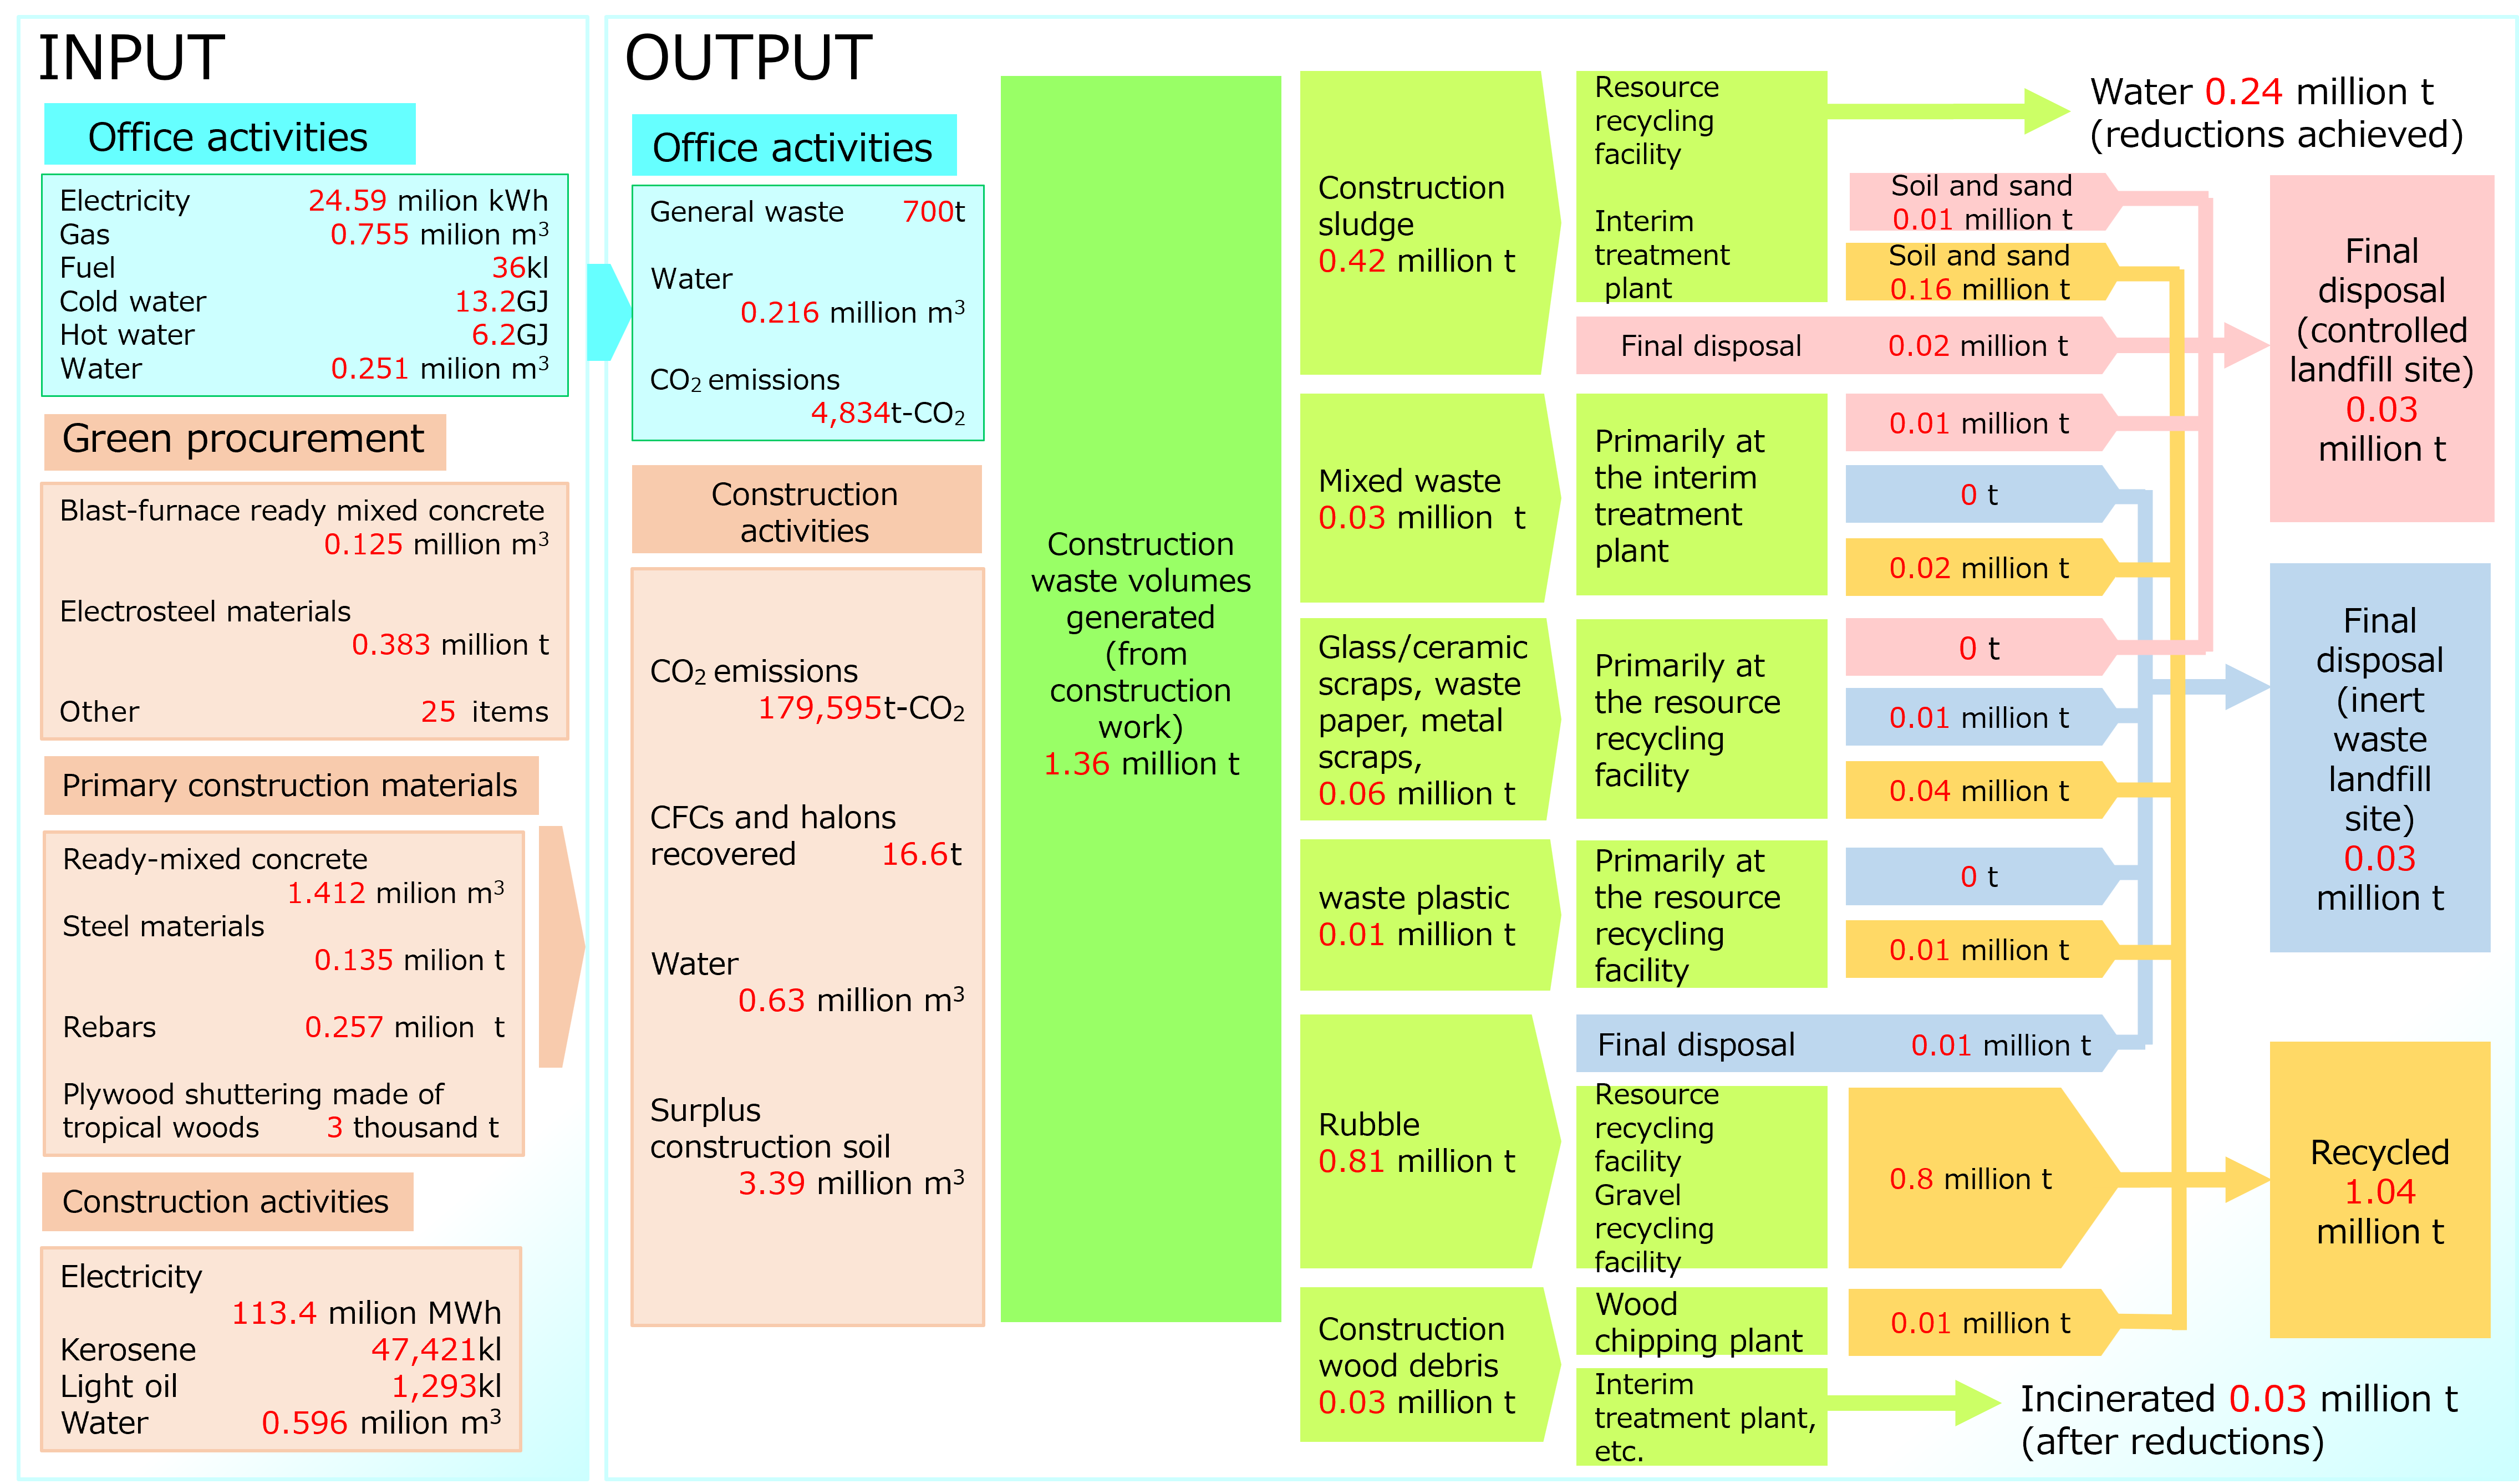
Material Flows(Domestic consolidated)
The flow chart below shows the flow of energy, water, and material input and waste, water, CO2 , and material output from Shimizu's office and construction activities.
Calculation Standard
| Category | Item | Definition, calculation method, etc. | |
|---|---|---|---|
| CO2Emissions: Results and Goals (Scope1/Scope2) |
During Construction | Scope1 | Act on Rationalizing Energy Use (Energy Conservation Act) Act on Promotion of Global Warming Countermeasures (Global Warming Countermeasures Act) Emissions per base unit of construction (t-CO2/net sales on completed construction (per ¥100 million) calculated at specified construction sites Based on the calculation method specified by the Japan Federation of Construction Contractors Energy used at construction sites is measured and calculated for each type of energy as shown below.
|
| Scope2 | |||
| Total | |||
| Own Offices + storehouses and factories |
Scope1 | Amount of electricity used at domestic locations x emissions factor based on the Energy Conservation Act, the Global Warming Countermeasures Act, and the GHG Protocol (t-CO2/amount of energy used) | |
| Scope2 | |||
| Total | |||
| Total | Scope1 | Total of the above. | |
| Scope2 | |||
| Total | |||
| Supply Chain CO2 Emissions | 1.Purchased goods and services | Basic Guidelines on Accounting for Greenhouse Gas Emissions Throughout the Supply Chain Database of emissions unit values used in calculating an organization’s greenhouse gas emiss ions throughout the supply chain GHG Protocol, Scope 3 and Standard Amount of activity and financial results x emissions factor |
|
| 2.Capital goods | |||
| 3.Fuel and energy related activities | |||
| 4.Upstream transportation and distribution | |||
| 5.Waste generated from business | |||
| 6.Business trips | |||
| 7.Employee commuting | |||
| 11.Use of sold products | |||
| 12.Disposal of sold products | |||
| 13.Downstream lease assets | |||
| Total | Total of the above. | ||
| Energy Use: Results | During Construction | Diesel, electricity, etc. | Energy Conservation Act and GHG Protocol Energy used at construction sites and offices is measured by the amount of kerosine, electricity, etc. used |
| Own Offices + storehouses and factories |
Electric power, cold and hot water, etc. | Energy Conservation Act and GHG Protocol Electricity used as offices and business locations is measured by the amount of electricity, thermal energy, etc. purchased. |
|
| Total | Total of the above. | ||
| Waste | Construction waste | Hazardous waste | The volume of hazardous waste and total waste (non-recyclable wasted, recycled waste) according the manifest, based on the Waste Management and Public Cleansing Act. The waste volume is calculated using manifest data. |
| Total Waste | |||
| Non-recyclable waste | |||
| Recycled waste | |||
| Office waste | Total Waste | Invoices, etc. from waste management companies for the volume of total general waste (non-recyclable waste, recycled waste), based on the Waste Management and Public Cleansing Act. | |
| Non-recyclable waste | |||
| Recycled waste | |||
| Water Intake Amount and Displacement | Water intake | During Construction | Aggregated total of invoices from water facilities. (Amount of tap water purchased for the workplaces and offices) For consolidated subsidiaries, construction-related calculations are based on the basic unit of sales and the net sales figures of each subsidiary. For office locations, calculations use the water consumption per employee at affiliates and the total number of employees. |
| Office | |||
| Total | Total of the above. | ||
| Water discharge | During Construction | During construction, create and calculate sales per unit of sales based on workplace sampling responses. The office has the same amount of water intake. |
|
| Offic | |||
| Total | Total of the above. | ||
Information Disclosure
We disclose information on climate change, etc. through our responses to the CDP corporate questionnaire.
CDP 2025 Responses (PDF:1.76MB) (Only in Japanese)
CDP Score
| Category | FY2022 | FY2023 | FY2024 | FY2025 |
|---|---|---|---|---|
| Climate change | A | A− | B | A |