NEWS
To ListFilter : CATEGORIES
- ALL
- CASE
- TOOLS
- OTHERS

Setback Restrictions
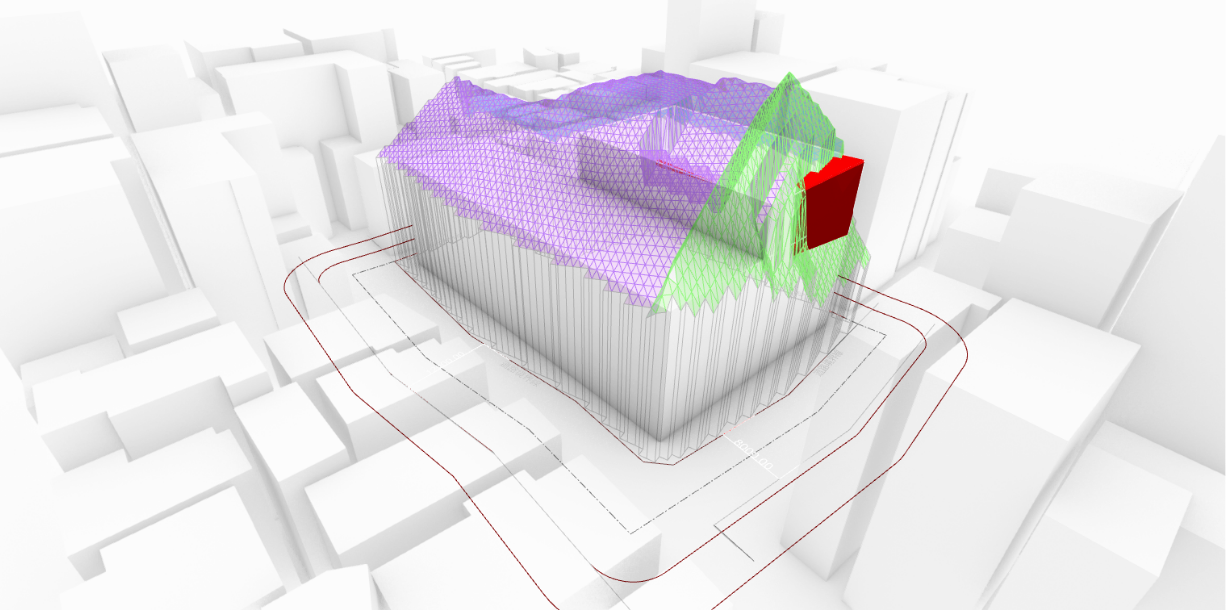
A legally compliant volume is automatically generated for the site shape, and an error judgment is performed to see if the planned building is within the height limit. You can also use this tool to search for the legal maximum volume.
Developed in cooperation with: Algorithm Design Lab, Seikatsu Sangyo Laboratory
【Examples of using these TOOLS】
Sky Factor
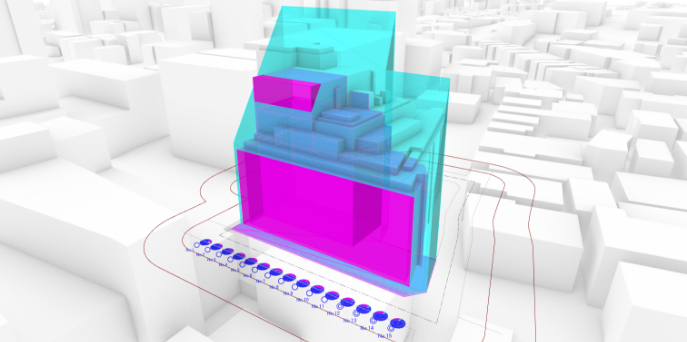
The sky factor is automatically calculated for the site and building shape, and the sky map and calculation results are displayed on the Rhinoceros screen. Results are updated in real time as the building shape changes.
Developed in cooperation with: Algorithm Design Lab, Seikatsu Sangyo Laboratory
【Examples of using these TOOLS】
Shadow Regulations
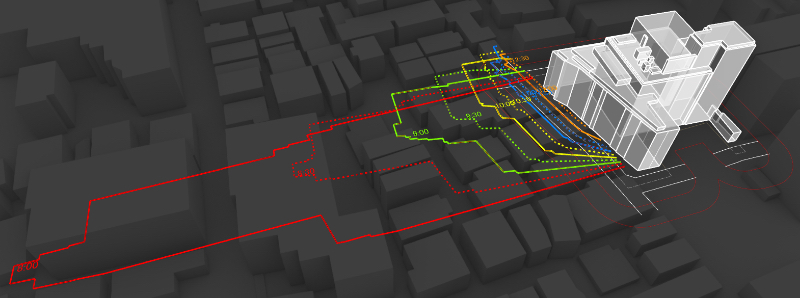
Create a time-of-day shade map and an isochronous shade map for the planned building. It is also equipped with a check function that colors the building parts that are out of regulation. It enables quick volume studies with simple operation and visualization of regulations.
Developed in cooperation with: Algorithm Design Lab, Seikatsu Sangyo Laboratory
【Examples of using these TOOLS】
Area Calculation
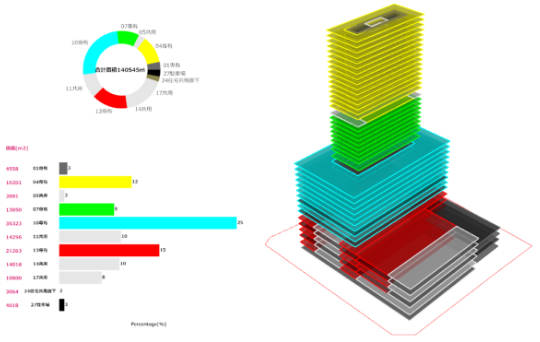
The area is calculated for each room use from the created building model and displayed as a graph on the screen. This area information graph is updated in real time as the building shape changes. By exporting the information as an area table, it can be used for business feasibility evaluation, etc.
Line-of-Sight Verification
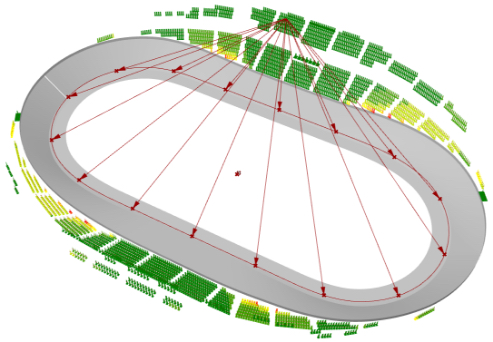
Evaluate the line of sight from the assumed viewpoint to the target in the planned building shape. This verification enables a variety of studies, such as reviewing the terraced floors of stadiums, theaters, and halls, and examining the designs of louvers that block the line of sight.
Weather Analysis

Annual outdoor temperatures such as AMeDAS weather data is visualized on a chart. By coloring the outside temperature range of 18-26 °C, it is possible to analyze the seasons and time periods suitable for natural ventilation.
Tools used: ClimateStudio
Sunlight Hours
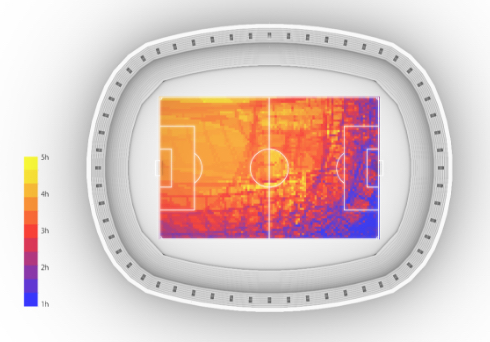
Calculate the sunlight hours while considering the shadows cast by sunshade devices and obstacles. It is possible to consider outdoor stadium lawns and tree growth in landscapes.
Tools used: ClimateStudio
Outdoor Airflow
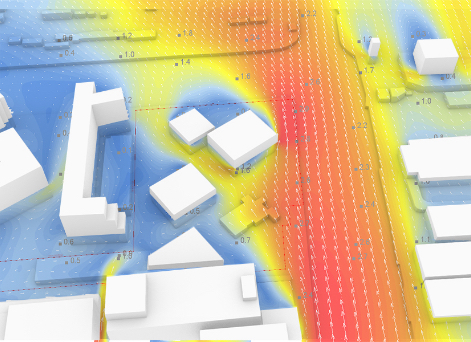
Analyze the wind flow around a building, allowing for building placement with consideration for wind passage, and window layouts for natural ventilation.
Tools used: STREAM
【Examples of using these TOOLS】
Natural Ventilation
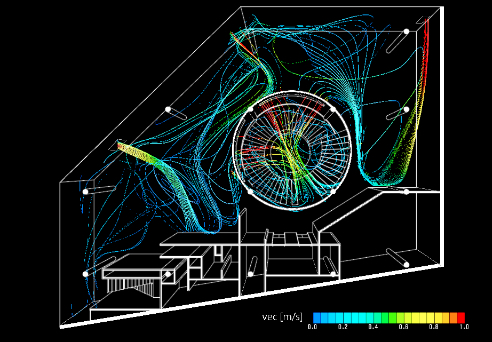
Analyze the ventilation volume, room temperature, and indoor air velocity when natural ventilation is implemented. It is possible to study natural ventilation that is closer to the actual situation, reflecting the effects of outdoor airflow.
Tools used: Archsim, STREAM
Rainwater Trajectory
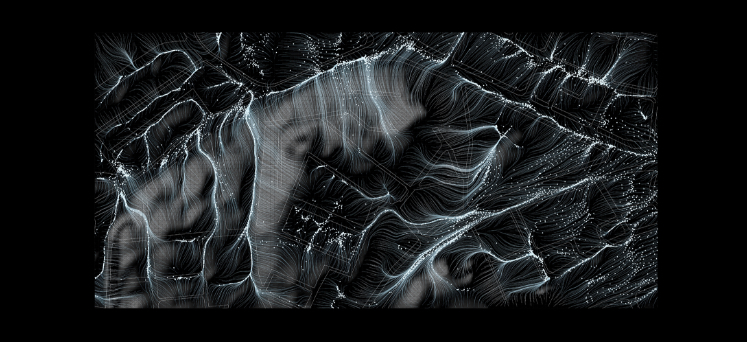
Simulate the flow of rainwater that falls on the ground. By visualizing the rainwater trajectory due to the ground surface slope, it is possible to plan assuming for places where rainwater tends to collect and for hazardous areas that flow into the planned site.
Developed in cooperation with: Algorithm Design Lab
【Examples of using these TOOLS】
Thermal Load PAL*
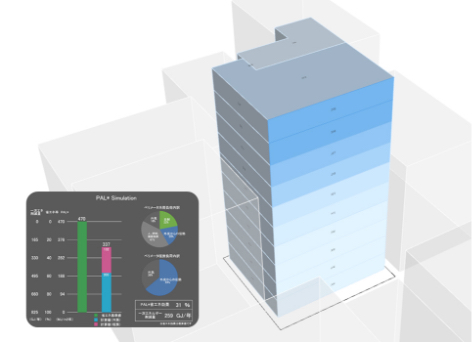
The thermal load of the perimeter is calculated while considering heat insulation and solar shielding effect. Thermal weak points are visualized by coloring the building surface, making it possible to consider energy-saving buildings with low thermal loads.
Thermal Comfort PMV
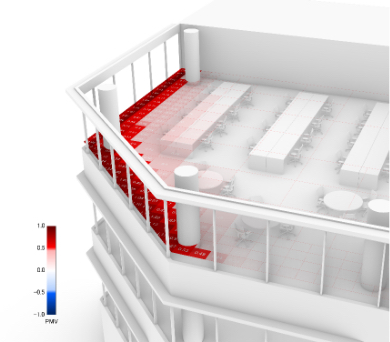
The thermal comfort PMV is calculated by analyzing the radiant environment considering the heat insulation and the solar shielding effect. It can also be used for airflow windows and push-pull windows, allowing for façade studies to realize a comfortable indoor environment.
Tools used: ClimateStudio
【Examples of using these TOOLS】
Daylighting + Electric Lighting
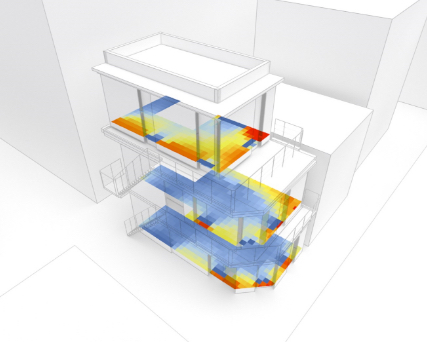
The annual illuminance distribution, brightness distribution, and energy-saving effect of natural lighting and electric lighting are calculated. It is possible to study window layouts and sunshade plans to realize an energy-saving and bright indoor environment.
Tools used: ClimateStudio
Glare
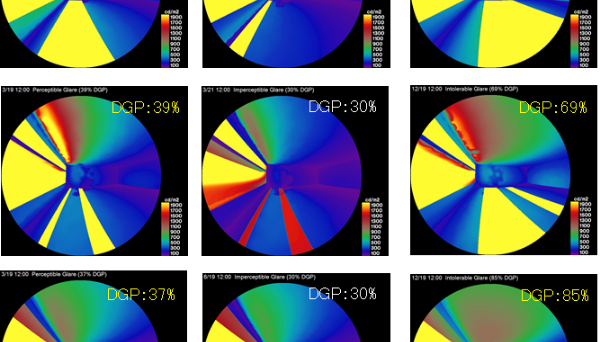
Calculate the annual discomfort glare rate at multiple points in the room. It is possible to verify the glare when natural lighting is used, and to consider window layouts and sunshade plans to realize a comfortable light environment. (DGP is used for the glare index.)
Tools used: ClimateStudio
【Examples of using these TOOLS】
Large Space Air Conditioning
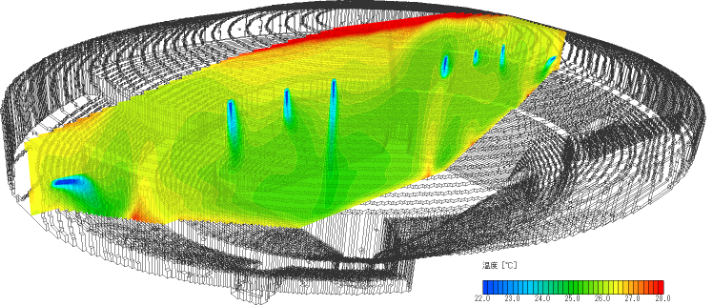
Analyze the distribution of indoor temperature and indoor air velocity in large spaces such as arenas and gymnasiums. By devising an air flow model, analysis time can be reduced, and multiple proposals can be analyzed in a short time, allowing for studies of optimal placement of supply and return registers.
Tools used: STREAM
【Examples of using these TOOLS】
Optimization
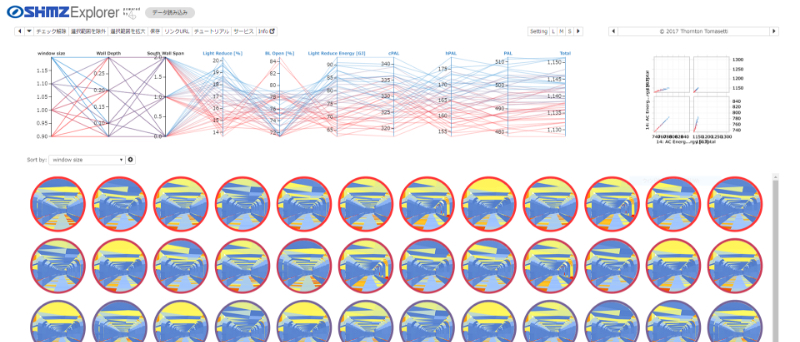
The optimal solution can be derived quantitatively using different approaches: (1) brute force method - narrow down the solution from a vast number of parametrically generated proposals by setting multiple target values or (2) multi-purpose optimization using a genetic algorithm.
Tools used: (1) Shimz Explorer (Developed in cooperation with: Thornton Tomasetti / CORE Studio, Algorithm Design Lab); (2) Octopus, modeFRONTIER
Pathfinding
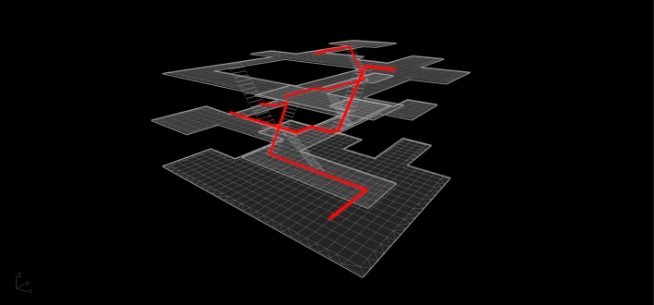
Once you set the start and finish points, the shortest path of circulation is calculated. By overlapping the paths from each room to the frequently used rooms, it is possible to visualize daily flow and locations of high interactivity in the building.
【Examples of using these TOOLS】
Adjacency Diagram
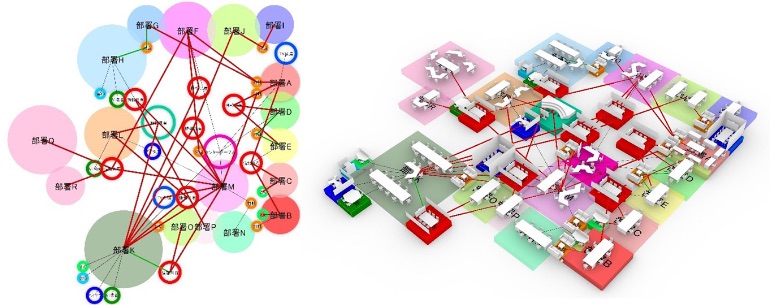
Visualize the relationship between spaces with different uses, such as department offices and specific function rooms. The size of the space is exhibited by the size of the circle, and the depth of the relationship, such as the frequency of meetings, is displayed by the thickness and color of the line. By switching the display, it is possible to perform the 2D zoning by freely moving the circles while studying the space in the 3D model at the same time.
【Examples of using these TOOLS】
Ground Plane Calculations

A tool that supports the "ground plane" and "average ground" calculations, based on which the setback restrictions and shadow restrictions are determined for the volume studies at the initial stage of design. A ground plane development map and a ground plane calculation table are automatically generated from the three-dimensional model reflecting the site gradient and the building perimeter shape. Information is updated in real time when the shape is changed, enabling quick examination.
HVAC
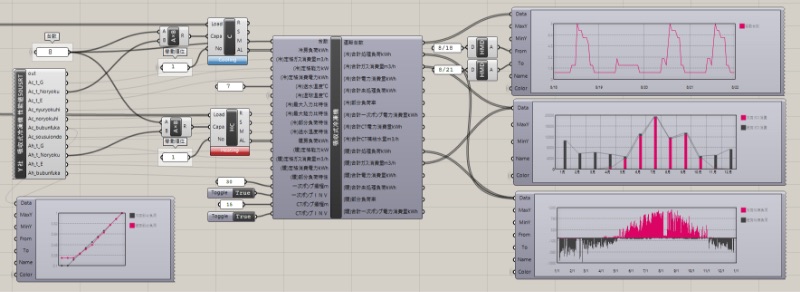
Calculate the consumption of electricity, gas, water supply, etc. of the HVAC system that uses the most energy in the building, allowing for studies of HVAC configurations that are energy-saving and have low running costs.
Brightness
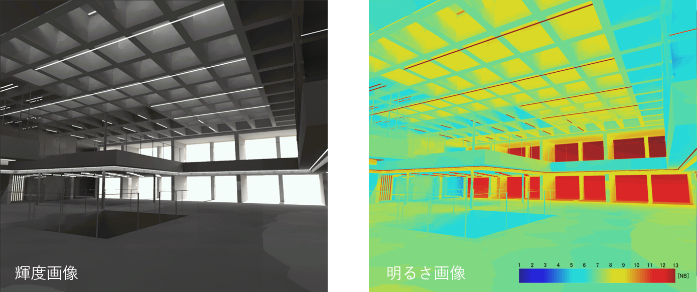
The "sense of brightness" felt by the human eye is evaluated using the brightness scale value (NB value). Unlike conventional evaluations based on illuminance, this allows for planning of daylighting and electric lighting based on the brightness perceived by humans.
Tools used: REALAPS, ClimateStudio
【Examples of using these TOOLS】
Terrain generation

A tool to generate terrain mesh in Rhinoceros from survey maps. Based on the generated terrain, it becomes possible to analyze and visualize the 3D terrain by various methods such as soil volume, contour line display, and gradient determination.
【Examples of using these TOOLS】
Visibility
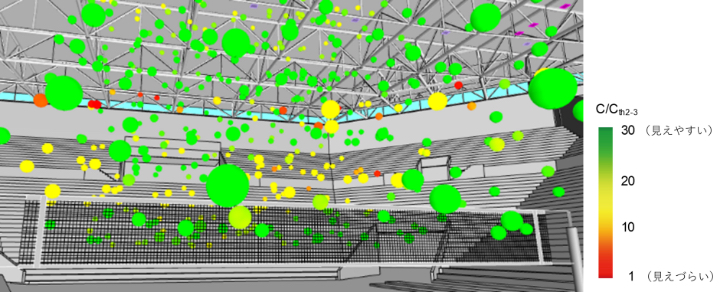
The visibility of the ball at any position in the indoor stadium is evaluated based on the contrast with the background brightness. Natural lighting and electric lighting plans can be created while considering the visibility of high side lights.
Tools used: REALAPS
Reflected Light

The reflected light from the building’s exterior wall surface is estimated using the direction of solar radiation utilized in environmental simulations. The geometry and rays of reflected light from solar radiation can be projected to the surroundings.
Tools used: Ladybug、Wombat、Sasquatch、TT Toolbox (Colibri)
Topology Optimization
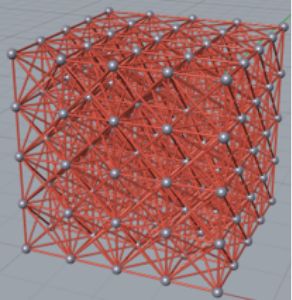
This tool creates ground structure (GS) 1) used for topology optimization. An efficient topology (form) for a specific external force & certain conditions is gained by applying topology optimization method to GS.
1)A structure composed of potential beam elements connecting inner nodes
Stress Analysis
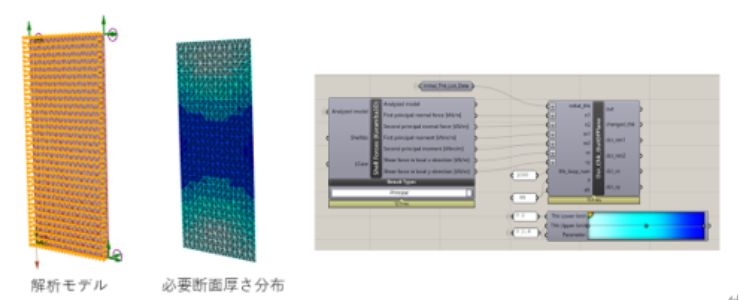
This tool enables parametric structural analyses by using Karamba 3D and EEL1), a structural analysis plug-in for Grasshopper. Structural engineers can check visualized member stresses/deformations and calculate required member sections.
1)EEL : https://www.dix.ne.jp/departs/structure/eel/index.html
Tools used:Karamba3D, EEL
Developed in cooperation with:DIX Co.,Ltd.
AI for supporting structural design
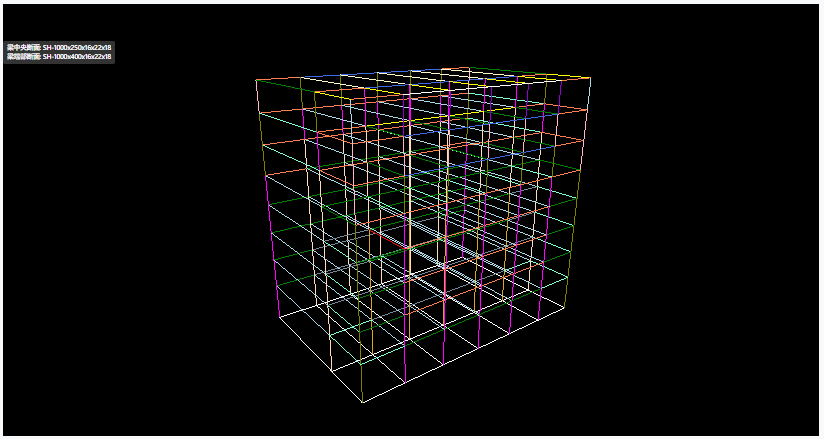
Generate a structural framework based on the building volume and allocate member sections using AI. This makes it possible to streamline structural review in the early stages of design.
Tools used:SYMPREST
Development collaboration:Headwaters Co., Ltd. and Headwaters Consulting Co., Ltd.
Pedestrian flow analysis
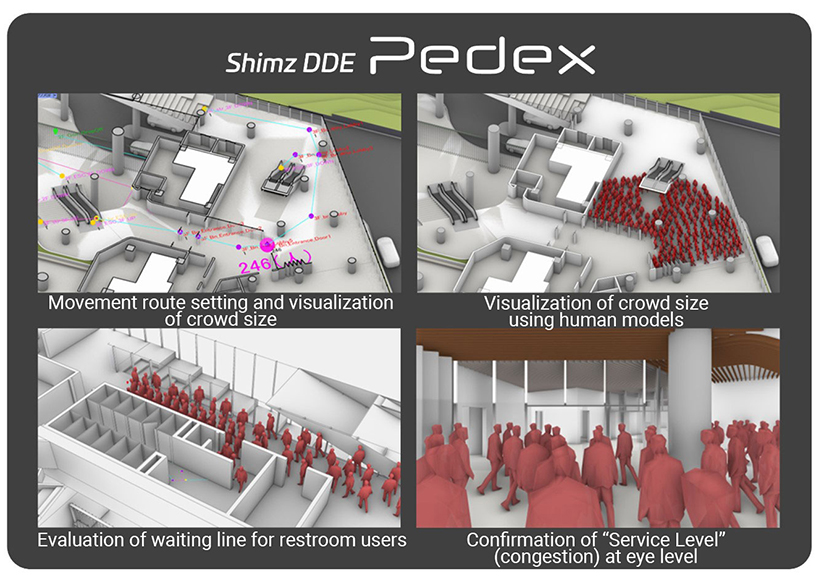
The target space is modeled as a network by setting entrances, exits, and branch points as nodes and using the connecting routes and corridors as links. Parameters such as the movement purpose, movement route, walking speed, the positions, number, and sizes of doors, and the width and length of corridors are set. These are used to calculate entry and exit times, crowd size, and other information.
Development collaboration:Vector Research Institute,Inc/Algorithm Design Lab/ Institute of Technology
Acoustic analysis
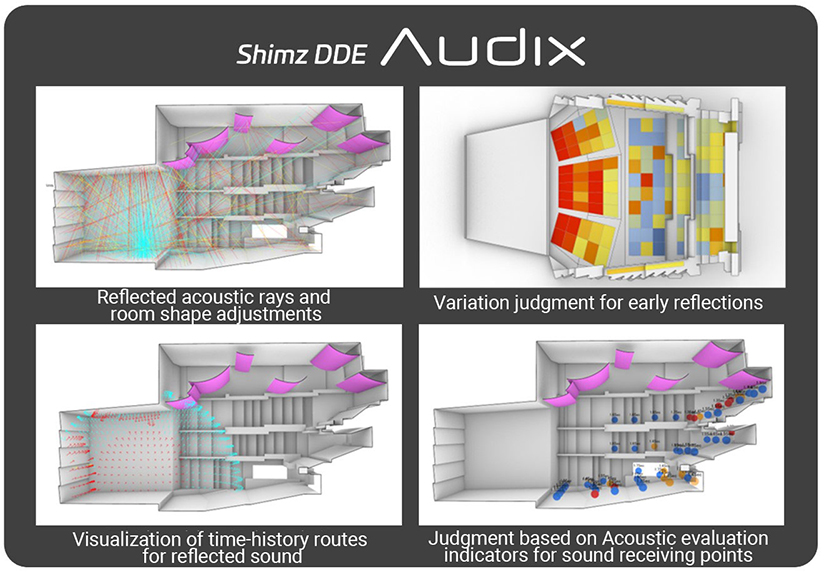
This system is based on a 3D model of the finished surfaces of the target space, such as the walls, floor and ceiling. It predicts the propagation of sound within the space by tracking the path of the sound emitted from the source on the stage as it is transmitted and repeatedly reflected. The materials and structure of each finished surface can be selected within the tool. This allows Acoustic performance elements to be set, such as how much sound is absorbed when sound bounces off each surface.
Development collaboration: Institute of Technology


