Shimz DDE

© Shunji Kitajima

CASE 03

Shimizu Hokuriku Branch Office
(Creative Field)

Communication and Space, designed at the same time

Three concepts are taken up in the reconstruction plan for our branch office: “adoption of new technologies that lead to the future," "integration with the history and traditions of Kanazawa," and "creating an office that contributes to work style reform and health promotion." Here we introduce an example of the study process in the initial stages of office space planning.

Site
Kanazawa City, Ishikawa Prefecture
Total floor area
Approx. 4,100 sqm
No of floors
1 floor below ground, 3 floors above ground
Structure
RC structure, S structure
Stage
Under construction (scheduled to be completed in 2021)

> Highest standard zero energy building, Shimizu Hokuriku Branch new office building

Realizing the "creative field*"
with computational design

We aimed to create an office (creative field*) that encourages more creative and flexible working styles by mixing various work areas on one plate. Using computational design, we explored the possibilities of new workspace planning from the relationships between "people" and "activities" and the characteristics of "space".

* Trademark registration is pending for “Creative Field.”

Diverse workplaces,
Loosely connected

Work space where various work areas are mixed

Evaluate organizational proximity1

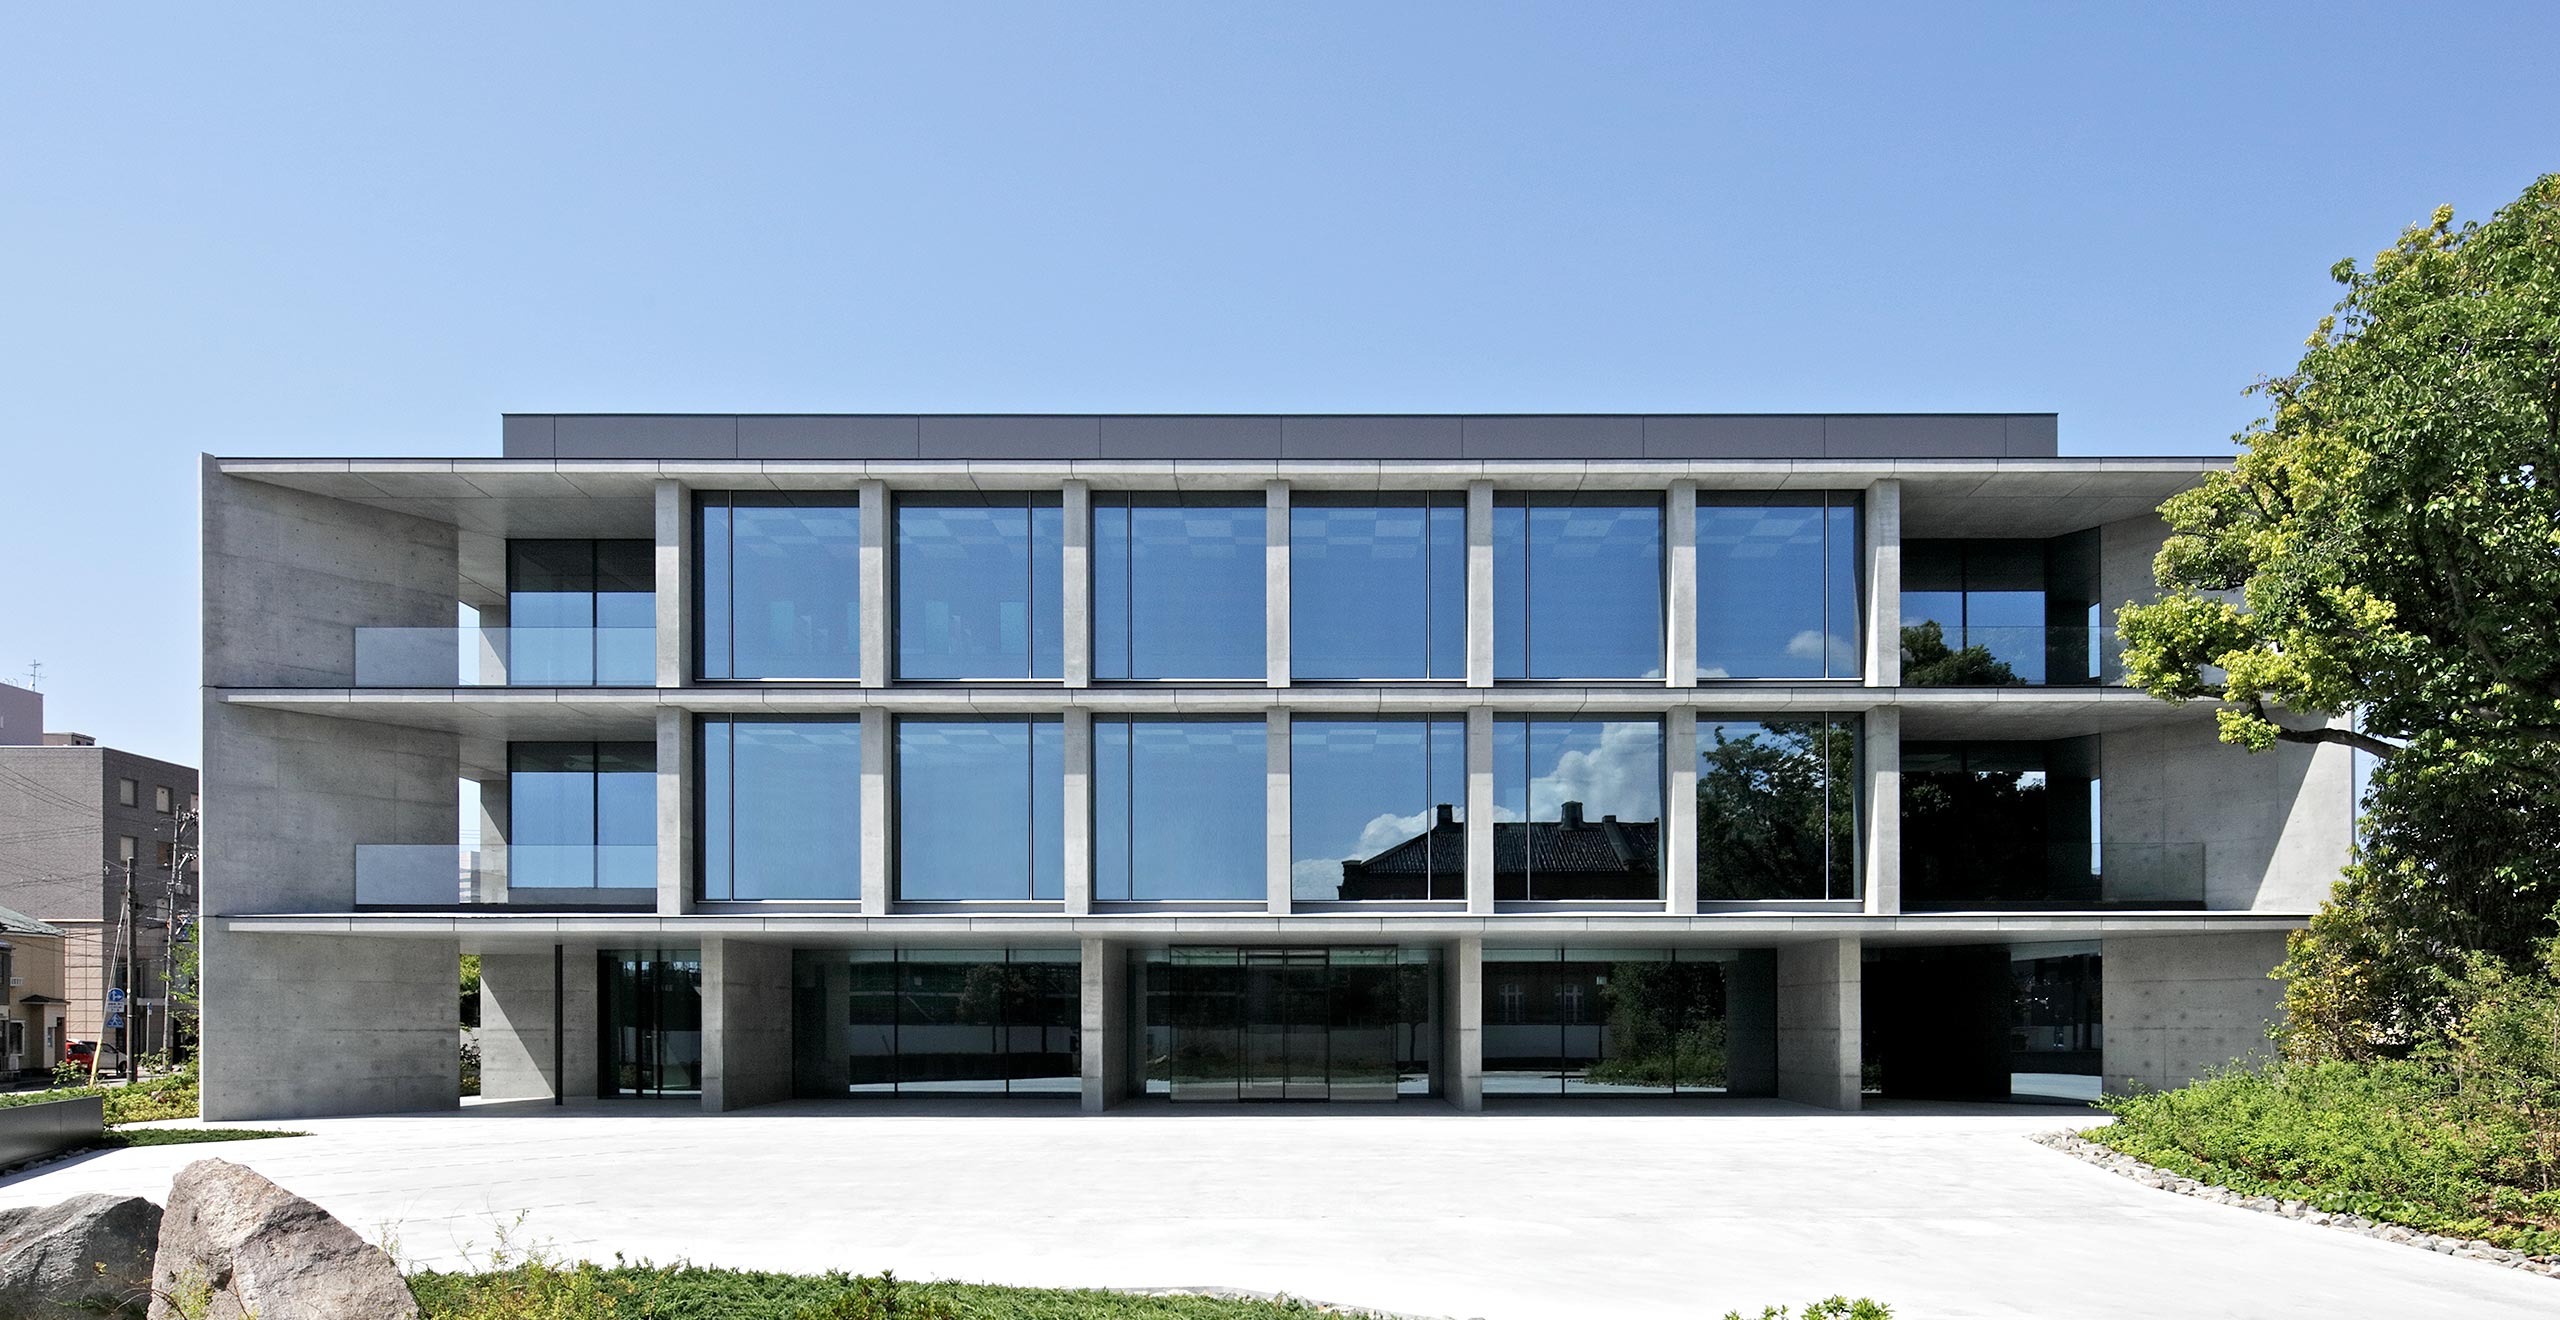
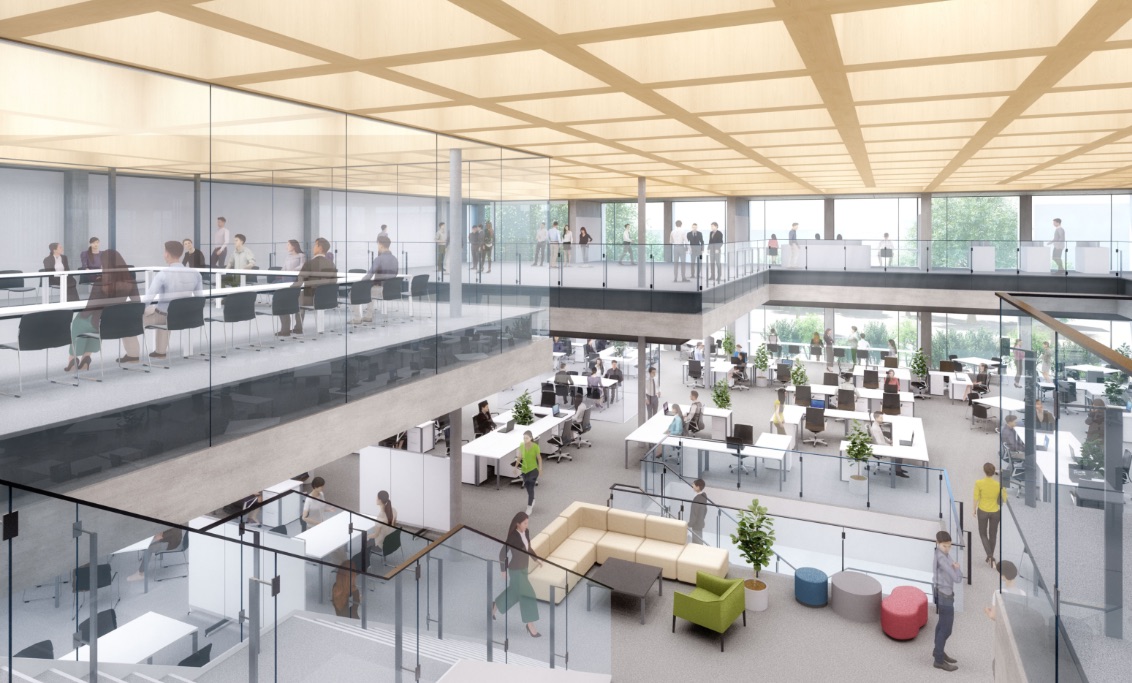
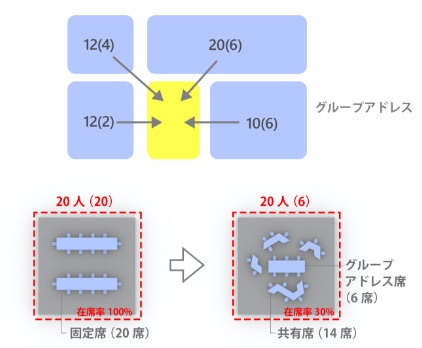
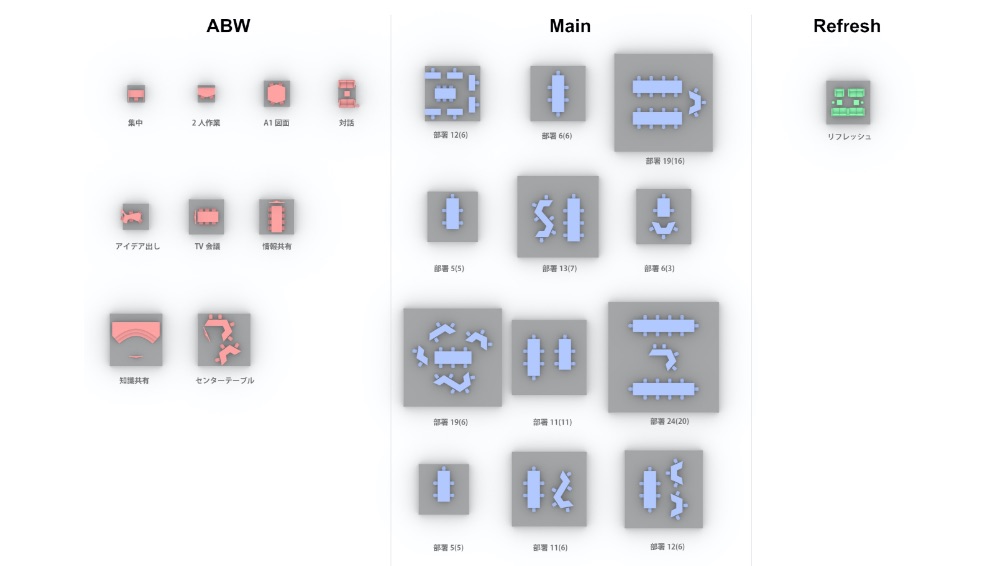
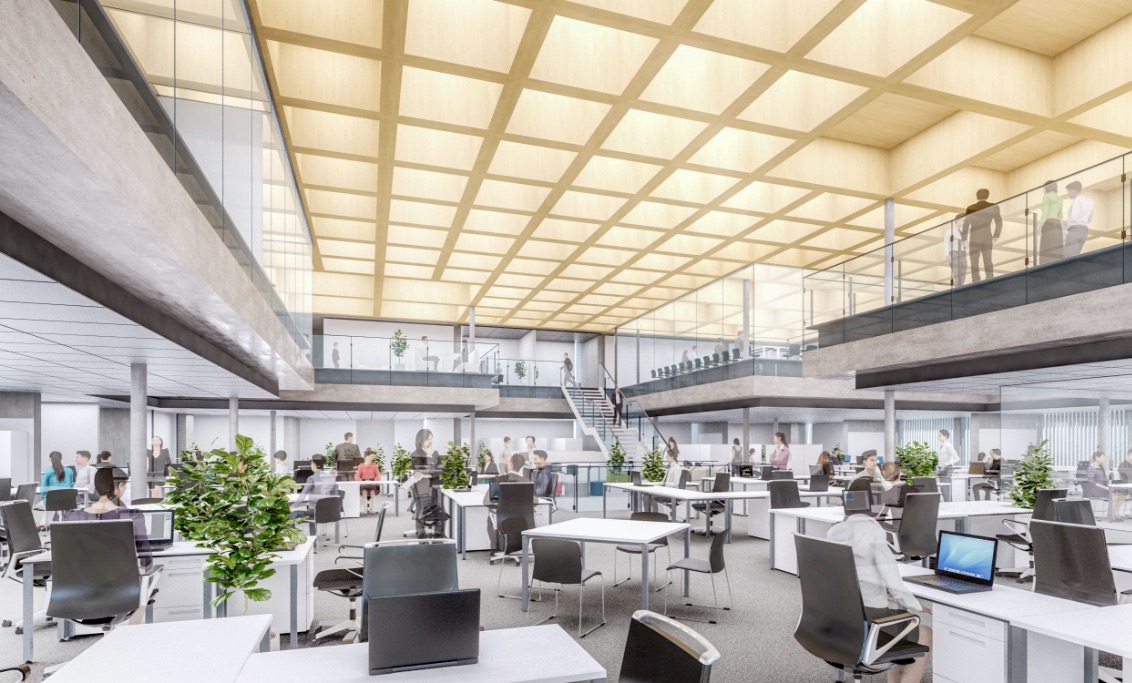
In the existing Hokuriku branch office building, the layout was based on departments with fixed seat operation, in what might be called an island-type office. But with the reconstruction, we aimed to introduce a free address (group address) system to realize a loosely connected and diverse workplace.
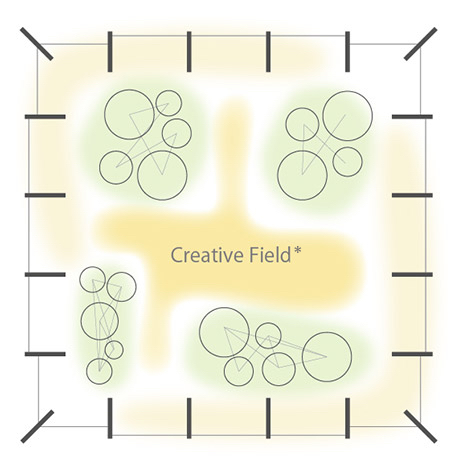
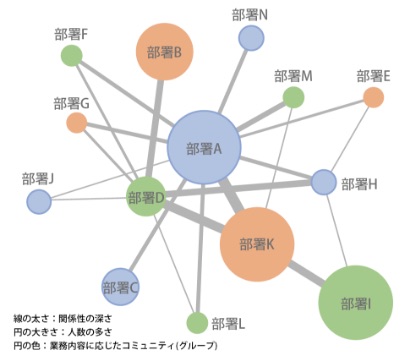
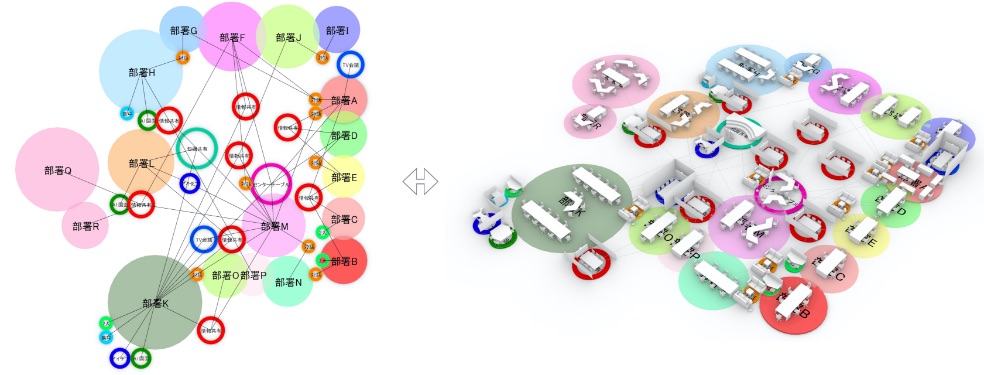
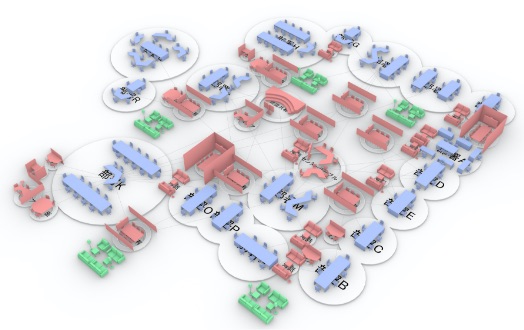
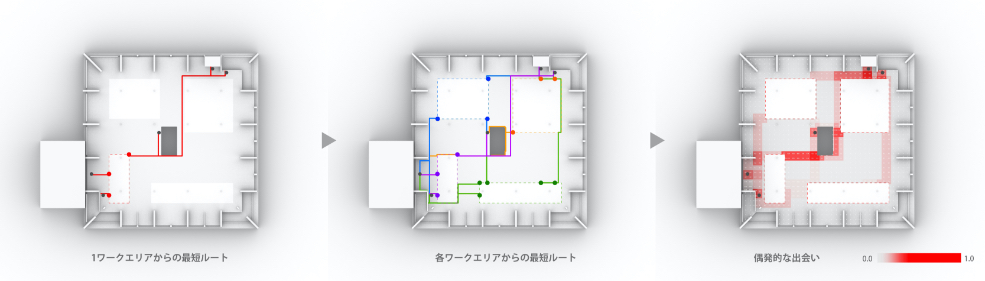
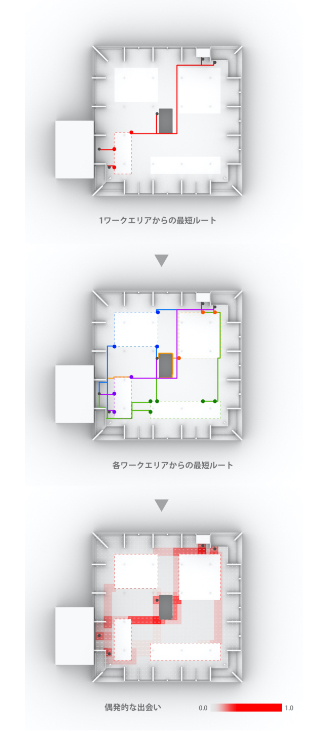
To that end, we conducted a questionnaire survey and used sensing2technology to research actual usage and work styles for approximately 150 employees at the Hokuriku branch. From the acquired data, the communication "between employees" and "between teams" was visualized as a network graph to understand proximity. Based on this graph, the employees were divided into several communities (groups) and this was reflected in floor zoning.

Network graph to visualize proximity

1 Proximity: The "depth of person-to-person relationships such as the frequency of communication" is regarded as proximity, and the number of direct face-to-face conversations between workers (cumulative time) is measured and quantified.
2 Sensing: A general term for technologies that measure and quantify various types of information using sensors. For this plan, a radio receiver was installed in the office and employees were asked to carry a beacon that transmits personal identification information at regular intervals to calculate their location. Additionally, the presence or absence of conversation was determined from the sound pressure information measured by the sound level meter.

Consider the relationship between departments and activities

An adjacency diagram was created by first preparing spaces and furniture that match the expected activities depending on the work content of each department, such as: "two-person work," "information sharing," and "dialogue," and then connecting closely related departments.
Each workplace is visualized whereby the size of the bubble corresponds to the number of enrolled people. The layout plan was created while considering the relationship between the bubbles and the linked space size.

Study process of planning considering adjacencies

Connecting the relationships between departments and activities in 3D

Considering the group address
Visualizing occupancy rates

Depending on the department, the rate of occupancy differs. Some departments have employees that frequently work outside the office and others have employees that mainly do desk work.
These differences are reflected in the furniture layouts and shapes and visualized in 3D. While planning, we considered the places that can be shared with other departments as well as a group address based on each community classified by the above-mentioned sensing survey (free address within a certain unit).

Plan more intuitively
By classifying workplaces

Each workplace was classified into the "main work area" which is the home base of each department, the "ABW3 area" which is shared according to work content, and the "refresh area" which is mainly used for breaks. These classifications were color-coded to allow for more intuitive layout planning through trial and error.

Color-coded adjacency diagram by activity type

The types of activity and associated furniture groupings

3 ABW: Activity Based Working, a work style that allows one to freely choose the time and place.

Spatial characteristics
Of the one-plate

The one-plate office space where you can overlook the entire area

Visualize the potential of the space using line-of-sight analysis

By mixing places where all departments can overlook the location and places where one is slightly hidden, we can expand the variety of spaces that suit diverse work styles.
At the same time as planning the placement of the core and the walls, we digitally visualized the potential of various locations by simulating the line-of-sight: places that were slightly protected or places where the symbol tree can be seen, etc. These location characteristics were used as a guide for the office planning plan.

Designing “chance encounters” from the main flow lines of each department

We created graphical visualizations of daily flow lines by automatically calculating and connecting the shortest paths between the main workplace of each department to the stairs and the WC, etc. The places where the flow lines overlap are also locations where employees from different departments meet by chance.
These were visualized by evaluating interactivity. We took the approach towards creating a lively and more creative space by designing in mechanisms to intentionally encourage communication.

Architectural Design

Shinya Okazaki

Workplace Planning

Maiko Ogawa


Computational Design

Shintaro Maki

Computational Design

Takehiro Amari

In the early stages of the project, we were able to consider workspace planning more broadly and accurately by carefully studying the given conditions and organizing and adjusting them parametrically. By analyzing multiple evaluation axes and creating visualizations, we were able to judge the characteristics and validity of various proposals at the same time. We were able to expand the number of possibilities and then use the criteria to help us find the optimal plan.